To create a dna sequences with repeated nucleotides, we can first create a vector having the repeat sequence and then repeat the multiple times using the rep function. The times keyword argument is used to specify the number of repetitions for the vector. We can also specify the output length using the lenght.out keyword argument. Another way to create a repeat sequence is to use each keyword argument which will repeat each element of the vector the specified number of times. The rep function will return a character vector.
 [1] "A" "C" "G" "T" "A" "C" "G" "T" "A" "C"
 [1] "A" "C" "G" "T" "A" "C" "G" "T" "A" "C" "G" "T" "A" "C" "G" "T"
 [1] "A" "A" "A" "A" "C" "C" "C" "C" "G" "G" "G" "G" "T" "T" "T" "T"
To get the sequence from the vector, we can use the paste function. Note that When a vector is passed to the times keyword argument then each character in the vector is repeated based on the value in the passed vector.
To create a random DNA sequence, we can use the sample function. The sample function will randomly select elements from a character vector. The replace keyword argument is used to specify whether the sampling should be done with replacement or not. If replace = TRUE, then the same element can be selected multiple times. Below, we create a vector of DNA bases and then do the sampling with replacement to get a random sequence of length 50. In this sampling each nucleotide has an equal probability of being selected. Let’s say we want to create a GC-rich sequence, then we can change the probability of selecting each nucleotide such that G and C will be selected more frequently than A and T. This can be achieved by passing a vector of probabilities for each nucleotide to the prob keyword argument of the sample function. In the code below, the A and T will have a probability of 0.2 each and G and C will have a probability of 0.3 each. The increased weightage on the G and C will result in a GC-rich sequence. The GC content of the sequence can be calculated using the formula given below. \[GC\ content = \frac{G + C}{Total\ bases} \times 100\]
[1] "GTCGAACCAGCGTGAGCTACACAGTGAGCCCCAATAGACGCTGCCTGTCT"
[1] "ATCCTAGGACCGCGCCGCCCCCGGCGACCAGGGCTAACGCCAGCCGCTCA"
[1] 58
bases
 A  C  G  T
12 16 13  9
4.3 Plotting GC content for random sequences
We can create multiple random sequences using the sample function. To automate this process, we can use the replicate function. The replicate function will repeat the code inside it for a specified number of times.
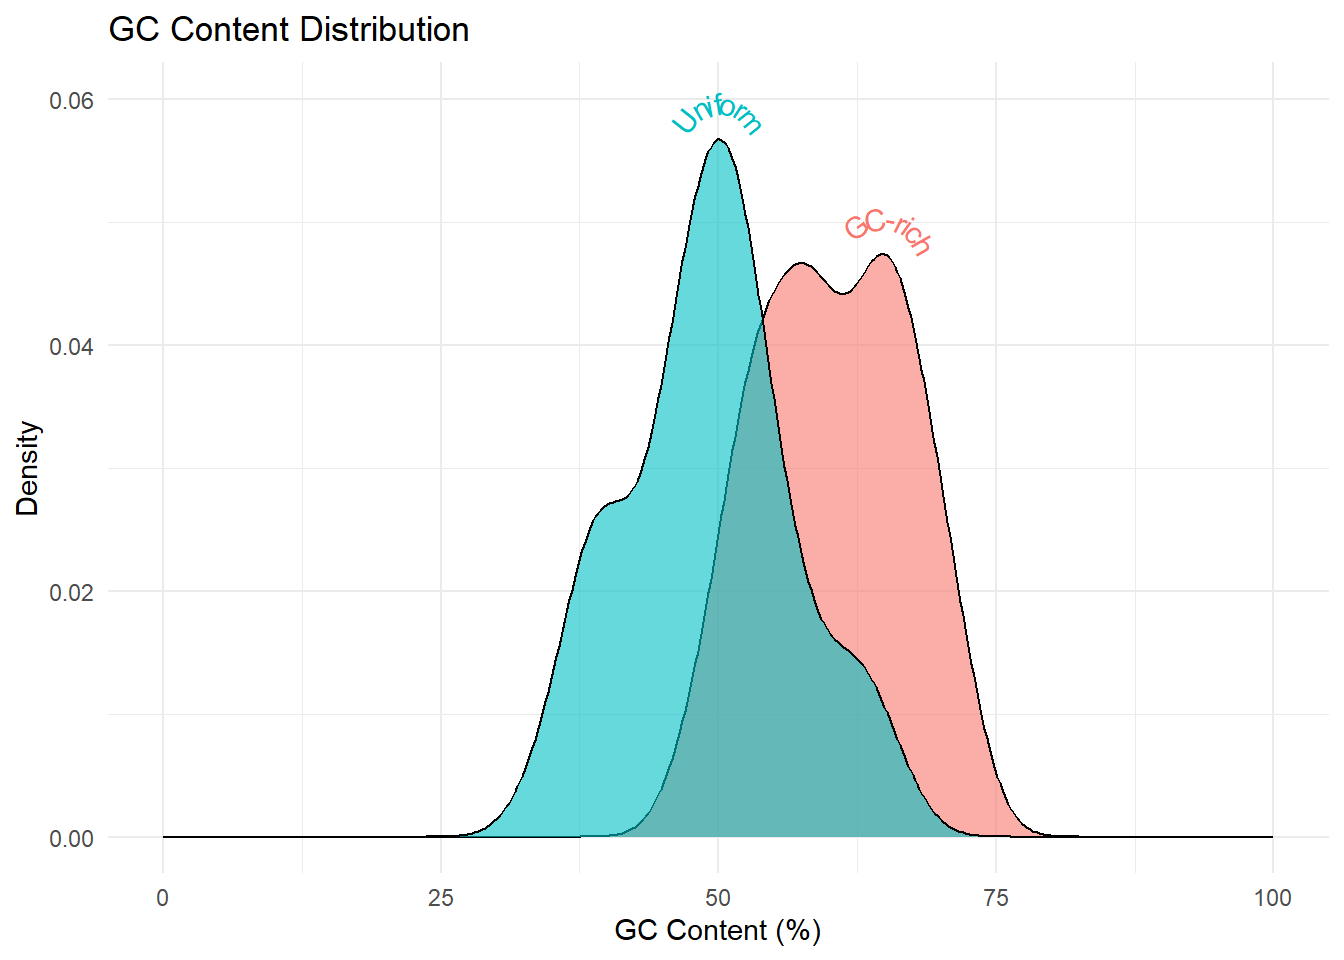
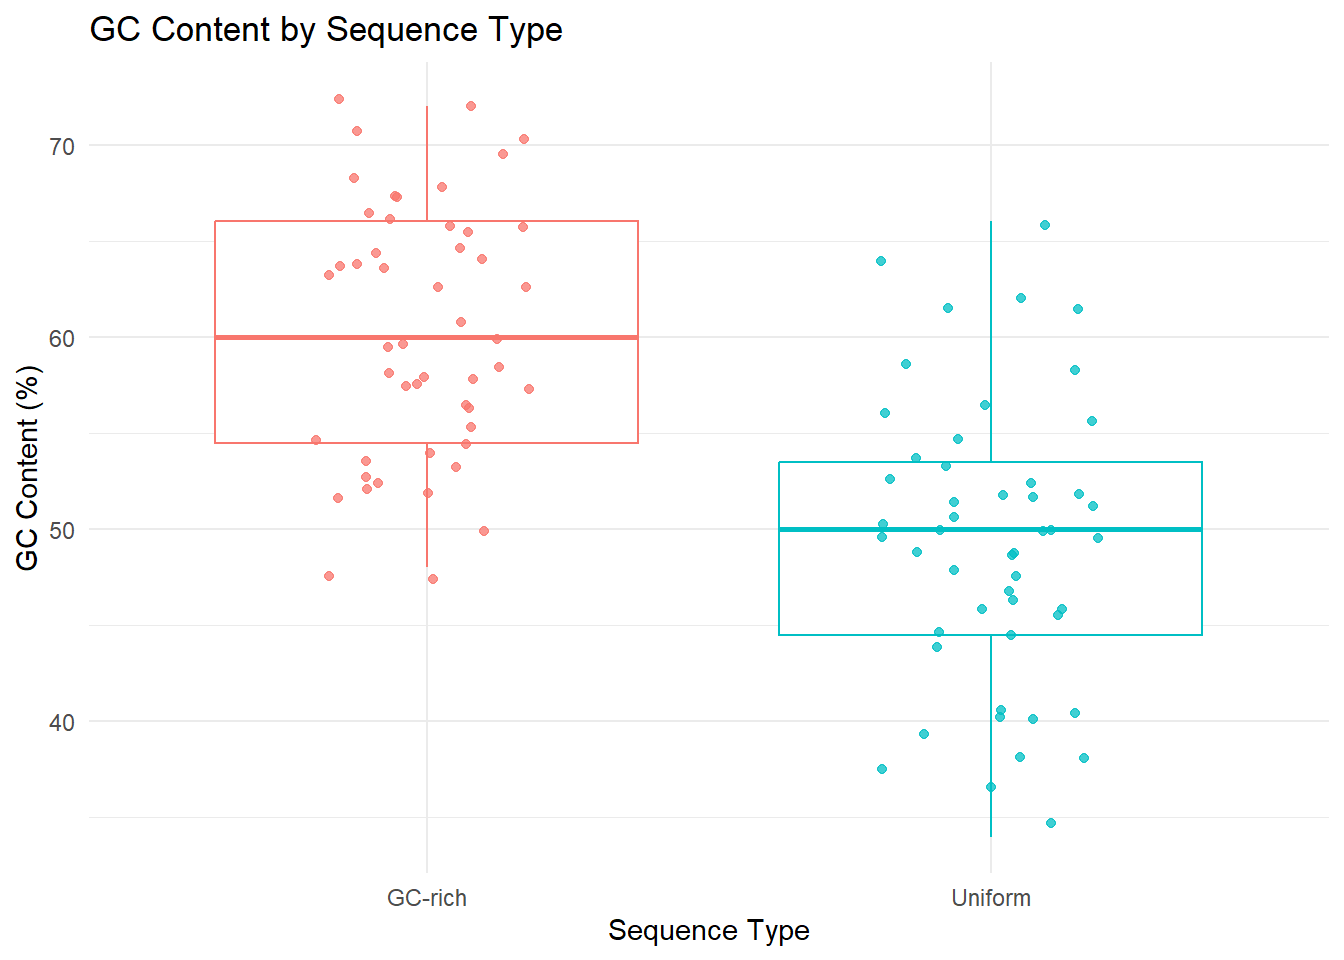
In the code below, the replicate function is used to generate two sets of random DNA sequences - 1) with uniform probabilities for all nucleotides and 2) with greater probabilites for the G and C. For both the sets, we’ll generate 50 sequences and then calculate the GC content for each set of sequences. The distribution of GC content in the two sets is visually analyzed using geom_density and geom_boxplot.
Warning: Removed 29 rows containing missing values or values outside the scale range
(`geom_density()`).
Warning: Removed 29 rows containing missing values or values outside the scale range
(`geom_textpath()`).
# boxplot and jitter plot ggplot(df, aes(x = Type, y = GC_Content, color = Type)) +geom_boxplot() +geom_jitter(width =0.2, alpha =0.75) +labs(title ="GC Content by Sequence Type",x ="Sequence Type",y ="GC Content (%)") +theme_minimal() +theme(legend.position ="none")
4.4 k-mer analysis
Many a times while doing bioinformatics analysis of DNA sequences, we need to extract sub-sequences of desired lengths. These sub-sequences are called K-mers, where k indicates the fixed length of the sub-sequences. These k-mer are generally extracted along the full sequence in a sliding window manner. The substring function allows us to specify the start and end positions of the substring that we want to extract. These two position can be specified as vectors as well. The code below extracts k-mers of length 3 from a given sequence. We can change the keyword argument k for the get_kmers function to extract k-mers of different lengths.
# Function to calculate k-mersget_kmers <-function(seq, k =3) { starts <-1:(nchar(seq) - k +1) ends <- starts + k -1substring(seq, starts, ends)}# Example sequenceseq <-"ACGTACGT"kmers <-get_kmers(seq, k =3)kmers
[1] "ACG" "CGT" "GTA" "TAC" "ACG" "CGT"
To count the frequency of each k-mer in a sequence, we can use the table function.
table(get_kmers("ACGTACGT", 3))
ACG CGT GTA TAC
  2   2   1   1
Note that in the Biostrings package, the oligonucleotideFrequency function can be used to count the frequency of k-mers in a sequence. This is a recommended option if you want to do k-mer analysis of DNA sequences in a computational optimized manner.